Following on the recent trend of InfoMaps from Flowing Data and a call to R users to attempt their own examples. I saw this lovely German visualization with R and decided it was time to do Ireland.
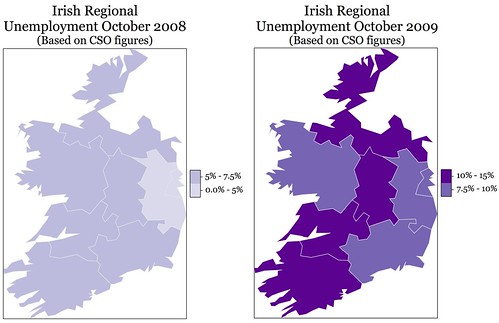
![IrishUnemploymentOct08toOct09]()
Looking at these images, I'm reminded of the lyrics of the song "What a Difference A Day Made", the one that goes like
Looking at these images, I'm reminded of the lyrics of the song "What a Difference A Day Made", the one that goes like
What a difference a day made,
Twenty-four little hours,
Brought the sun and the flowers,
Where there used to be rain...